Population Plotter (Data Visualization SPA)
Built:
(12/2023 - Current)
Summary:
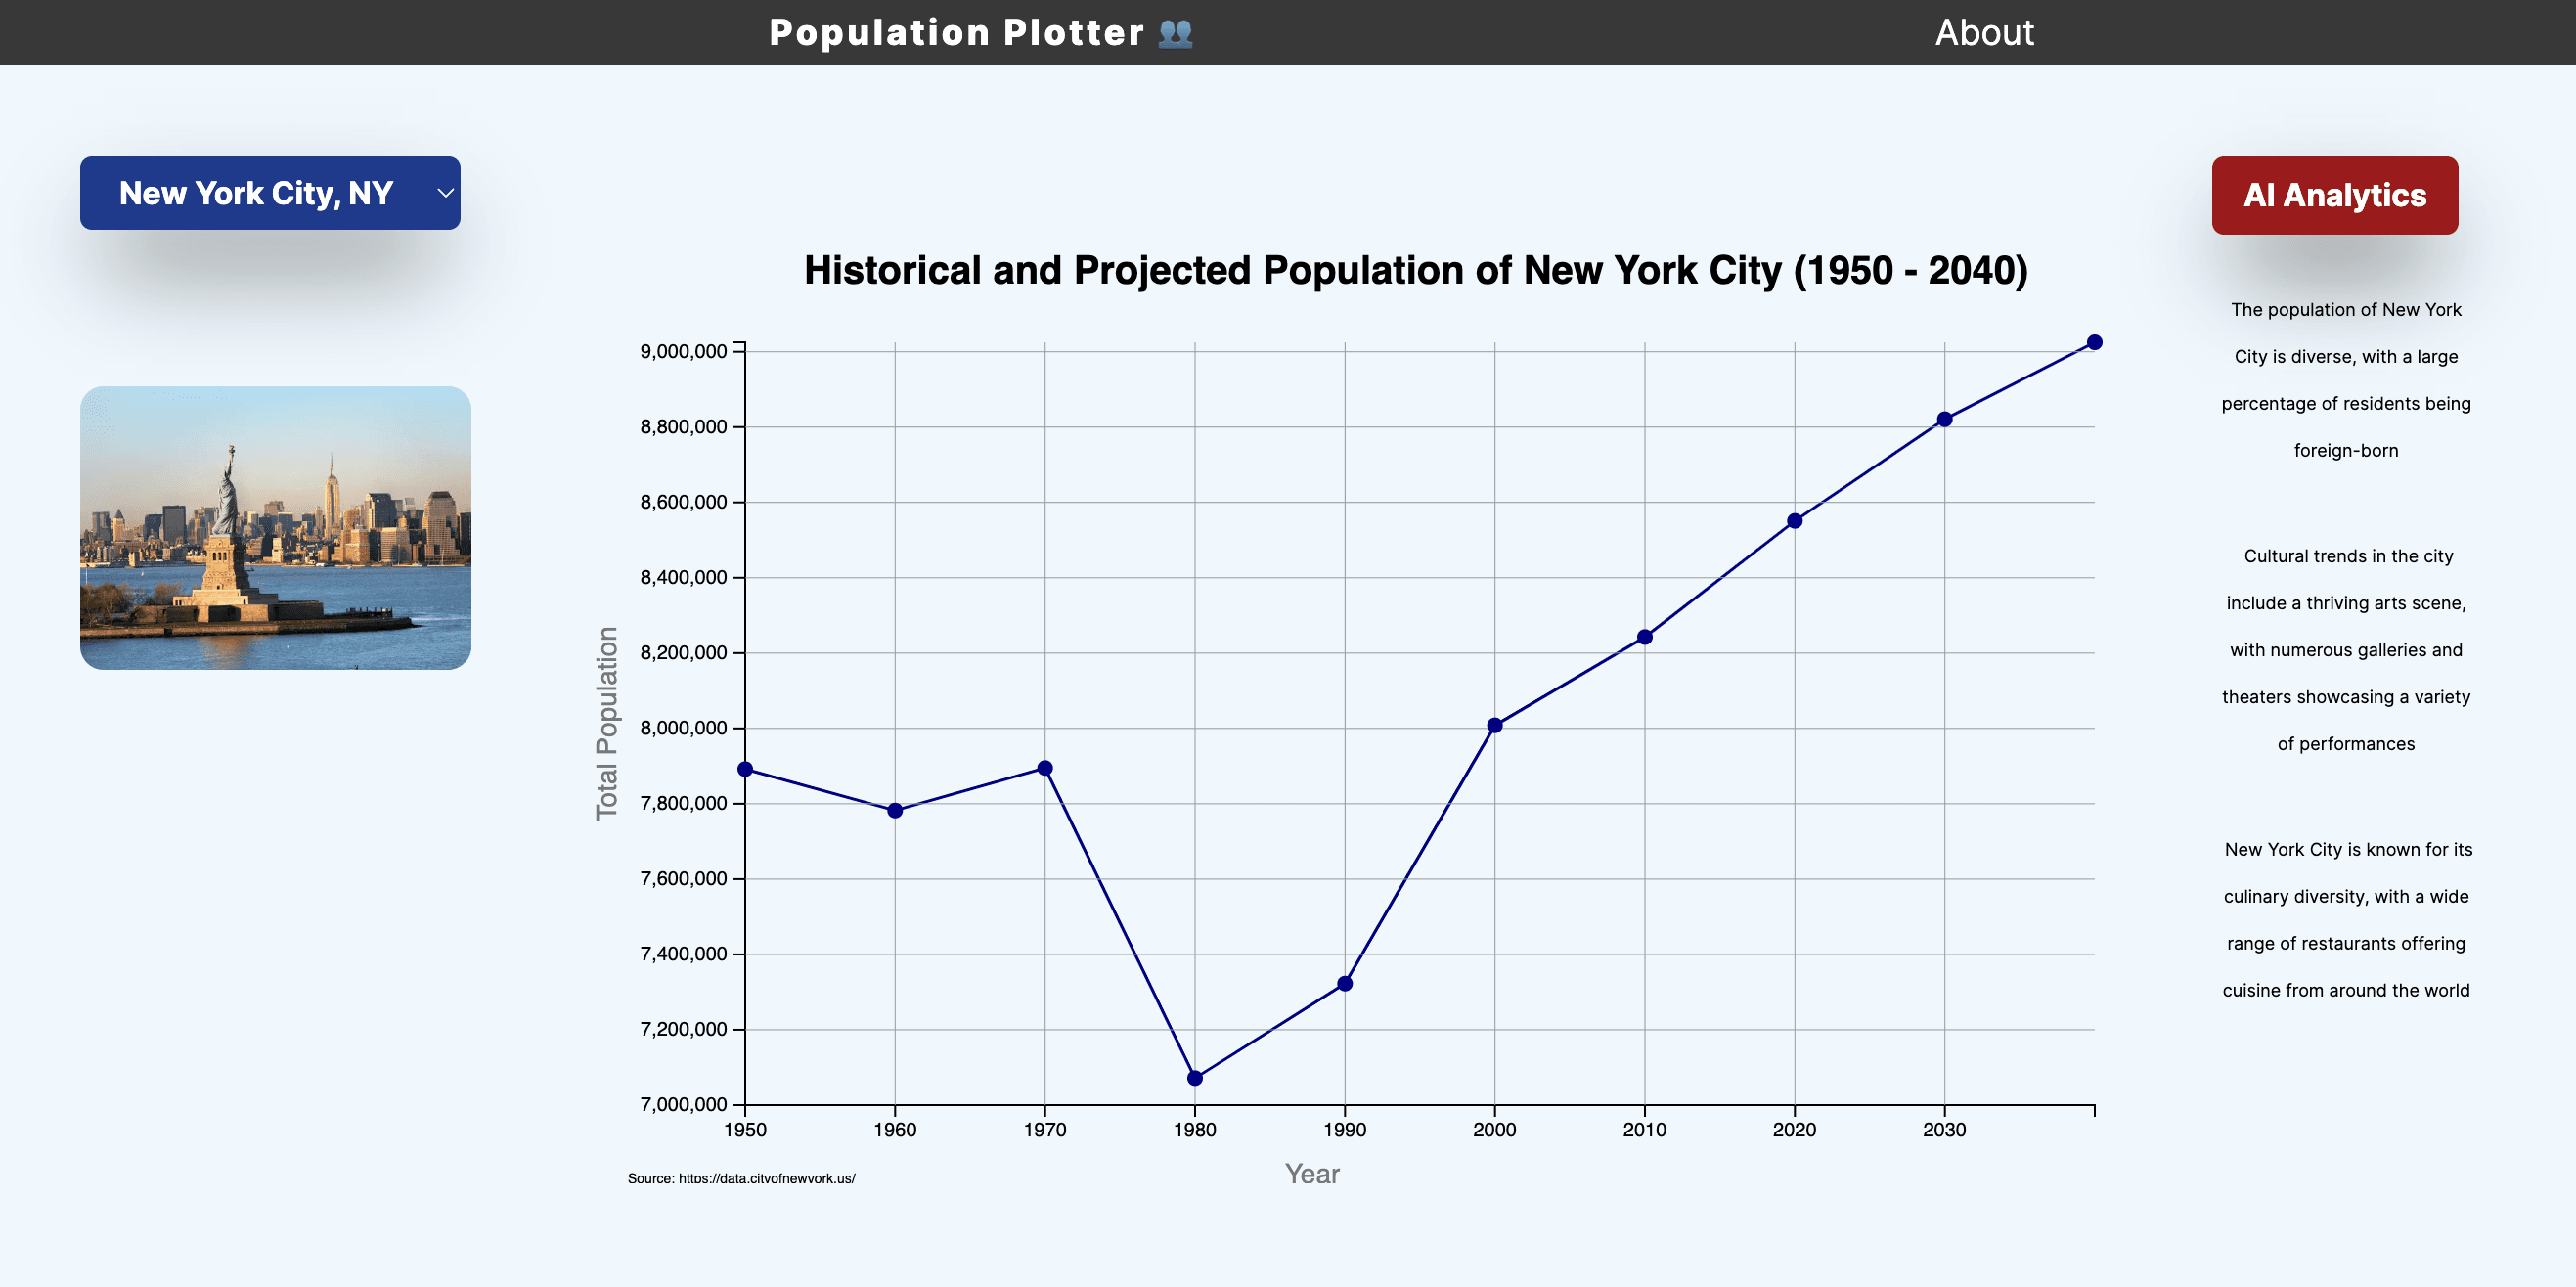
This is a single page application (SPA) that utilizes the JavaScript D3 library to read-in published urban population data of major cities and neatly plots the data on a line graph. Other features include an AI analytics button which dynamically provides population and culture trends based on what city is selected. The analytics feedback is powered by the OpenAI API.
Stack:
JavaScript, React, Tailwind CSS, NextJS, D3, OpenAI